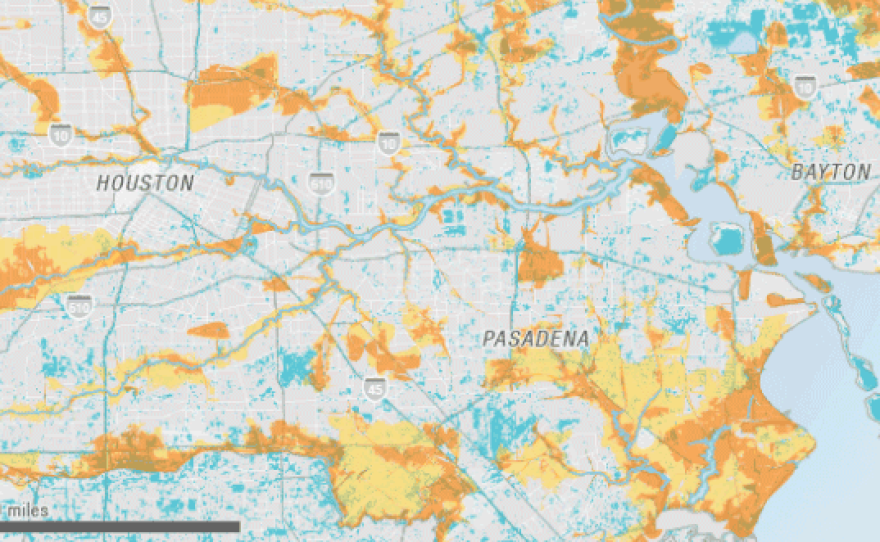
Scientists have produced a preliminary map of the flooding in Houston from Tropical Storm Harvey.
The map doesn't yet represent all the flooded areas, and for technical reasons, it likely understates the extent of flooding. But even this early analysis shows that flooding from Harvey extended well beyond the traditional flood plains mapped out by the federal government.
The map above was drawn with data from flood experts at the University of California, Davis Center for Watershed Sciences. The researchers used radar imagery from two polar orbiting satellites taken on August 29. That imagery likely underestimates flooding because trees and buildings on the ground can obscure the view of flooding from space. The map should not be used for emergency services or insurance purposes.
But what it does show is how much of the flooding occurred outside government-drawn flood zones. Two-thirds of the flooding was outside the 100-year flood zone, as defined by the Federal Emergency Management Agency (FEMA). And more than half the flooding was outside all flood zones — 100-year, 500-year or minimal hazard.
Team member Nick Santos points out that Houston has had several floods in recent years that qualify as 100-year or 500-year events. Harvey appears to have topped even those. Santos says this suggests the flood zone maps may no longer represent true risk for property owners. "So we need to rethink the total risk map for areas like this," he says.
Ultimately, that in turn, that may effect both private and federal flood insurance programs.
Copyright 2017 NPR. To see more, visit http://www.npr.org/.


