KPBS and inewsource partnered last year to do an in-depth look at the U.S.-Mexico border wall that already exists from California to Texas. We wanted to provide context for President Donald Trump’s campaign promise to build out and fortify the fencing that separates the two nations.
Since Trump will be in San Diego Tuesday to look at the wall prototypes his administration paid contractors $20 million to build in Otay Mesa, we wanted to share what we uncovered about the current wall.
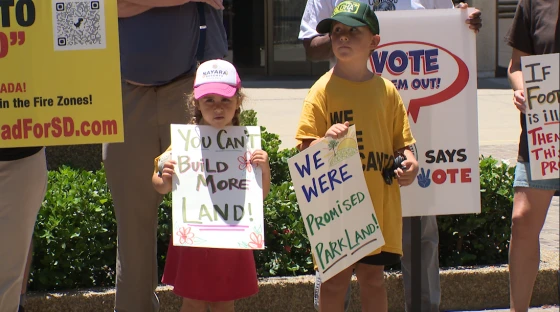
RELATED: Trump’s Planned Visit To San Diego Draws Supporters, Protesters and Tight Security
Using previously undisclosed data from the federal government, we were able to build a map that shows every piece of fencing along the border and when it was constructed. We layered that data with illegal immigration patterns over several decades and enforcement initiatives under previous presidents.

The map shows today’s wall is relatively new — nearly 90 percent was built in the past 13 years.
Here’s more of what we found as part of our “America’s Wall” reporting.
Q: How much of the U.S.-Mexico border is covered by fencing?
A: Fencing covers 653 discontinuous miles of the 1,954-mile border. About 37 miles of that fencing is backed up by a secondary wall.
California, Arizona and New Mexico have the greatest share of fencing. In Texas, hundreds of miles can stretch between sections of fencing.
Q: What types of fencing exist along the border?
A: There are two main types of fencing, with each defined by what they are intended to stop: pedestrians and vehicles.
Types of pedestrian fencing range from Vietnam-era landing mats made of corrugated steel to tall steel pillars with small gaps between them. The types and styles vary widely along the border.
RELATED: Decades-Long Struggle To Secure US-Mexico Border
Pedestrian fencing is also broken down further into primary, secondary and tertiary:
—Primary pedestrian fencing covers 403 miles, the greatest share of fencing.
—Secondary pedestrian fencing covers about 42 miles in mostly urban areas. The area between primary and secondary fencing often includes dirt roads for U.S. Customs and Border Protection patrol vehicles, digital surveillance such as infrared cameras and vibration sensors.
—Tertiary fencing covers less than 17 miles. In San Diego, it most often consists of barbed wire fencing.
Vehicle fencing is intended to stop motorized vehicles from entering and is broken down by permanent and temporary fencing.
—Permanent vehicle: Most of the 181 miles of this fencing is in Arizona. It can be as simple as railroad ties forming a rudimentary picket fence.
Temporary vehicle: Most of the almost 119 miles of this fencing is in El Centro; —Tucson, Arizona; and El Paso, Texas. Some it is called “Normandy” fencing — metal X’s holding railroad ties.
Q: What impact has border fencing had on illegal immigration?
A: While the answer to this question has caveats, such as the strength of the economies north and south of the border and U.S. immigration enforcement efforts, inewsource used data about fencing construction and apprehensions over time to take a more quantitative approach.
In general, as fencing increased along the border, apprehensions in construction areas dropped. But people didn’t stop trying to enter the country illegally. They shifted to less-fortified and more remote areas of the border.
The same is true for ramped up illegal immigration enforcement initiatives by CBP. For example, the majority of apprehensions along the border in the 1980s and 1990s — nearly half — were in San Diego. In the 1990s, President Bill Clinton ramped up fencing construction in San Diego and launched Operation Gatekeeper to make it harder for people to cross illegally into the U.S.
The result was the flow of illegal immigration shifted east toward Arizona.